Debugging CoffeeScript Line-by-Line
One of the main arguments against using CoffeeScript is that of debugging. CoffeeScript is compiled down to JavaScript before being sent to the browser which means we can only debug the compiled JavaScript version of our code, not the original CoffeeScript. Until now, that is.
Michael Ficarra’s successful kickstarter project to create a ‘better CoffeeScript compiler’ now allows us to generate source maps for our CoffeeScript. Google Chrome already supports source maps, which means you can now debug CoffeeScript right in the browser.
Example
Here is some very simple CoffeeScript that I’m going to try and debug.
eat = (food) ->
  console.log food

eat(food) for food in ['toast','cheese','wine'] when food isnt 'cheese'
I’m going to use the CoffeeScript compiler that is packaged through npm to compile the example. Version 1.6 (or later) has native support for source maps.
To compile with source maps, you simply need to pass the -m flag.
coffee -cm example.coffeeThis will generate 2 files – example.js and example.map. More importantly, the compiler will put a comment in the JavaScript file to indicate to the browser where to find the source map file.
/*
//@ sourceMappingURL=example.map
*/
I created some very simple HTML to load my JavaScript.
<html>
<head>
<script type='text/javascript' src='example.js'></script>
</head>
<body>
<h1>Example of CoffeeScript Debugging</h1>
</body>
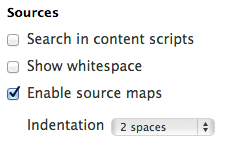
</html>The last step is to enable source maps in Google Chrome. Open up the developer tools and look for the settings icon in the bottom right.
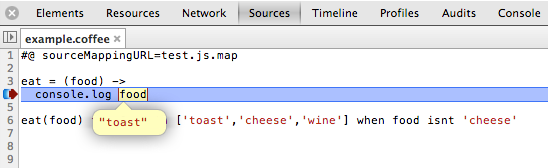
Now if you look in sources you should see your CoffeeScript file and be able to add break points, hover to view variables, etc.
The problem of debugging CoffeeScript, the most popular and strongest argument for not using it in the browser, has been solved! We still can’t type CoffeeScript into the console, but that day can’t be far off. Happy coding.